For a major US technology company, the time it took for components, racks, and servers to go live from the moment they were ordered was taking several years, and the number of components required varied significantly and was difficult to estimate accurately. They needed a model to predict with precision the number of components they would require and the probability of a component going live.
I was part of the development team, and during my time on the project I contributed to three main areas:
- Development of the predictability model using survival analysis
- Improvement of the model by performing an embedding of categorical variables using XGBoost
- Development of the visualization dashboard using Bokeh
Data
Although the data was confidential, the input data was gathered from client servers, including go-live estimates for different rack types across multiple regions and dates. The features selected were mainly categorical, as these had the best data quality. Some of the issues we encountered included poor quality numerical data and inconsistent go-live dates from different teams involved in the company’s processes. Part of the preprocessing involved addressing and resolving these data quality issues.
Survival Model
Survival modeling, or time-to-event modeling, is used for modeling censored data. For our cycle time data, we needed to account for the most common type of censoring: right censoring.
A true event time is said to be right-censored if the event did not occur at the time when the analysis is performed, so it is only known that the true event time is larger than the end of the observation period. In our case, this means that the go-live time of the cluster is greater than the observation period.
Assume that the time $T$ is a nonnegative continuous random variable with a density function $f(t)$ and a corresponding distribution function $F(t) = P(T ≤ t)$.
The survival function of $T$, the probability of an individual cluster not going live beyond time $t$, is defined by
\[⁍\]Also, from the definition of $F(t)$ we obtain that
\[S(t) = 1 − P(\text{an individual fails before or at t}) = 1 − F(t).\]Notice that S(t) is a monotonically decreasing continuous function with
\[S(0) = 1 ,\quad S(\infty) = lim_{t→∞} S(t) = 0.\]The hazard function $\lambda(t)$ is defined as $\lambda(t) = f(t)/S(t)$.
We can think of it as the instantaneous rate of going live at time $t$, given that the cluster hasn’t gone live just prior to $t$.
Also, since $f(t) = -\frac{dS(t)}{dt}$, it is easy to see that
\[\lambda(t) = -\frac{d}{dt}\log S(t)\]Then
\[-\log S(t) = \int_0^t\lambda(x)dx\]And
\[S(t) = exp\left(-\int_0^t\lambda(x)dx\right) = exp\left(-\Lambda(t)\right)\]The distribution of survival time is often positively skewed. The exponential and Weibull distributions are popular choices for modeling survival data. For this project, we used a Weibull distribution.
Embedding using XGBoost
The most obvious way to encode categorical data is through one-hot encoding (OHE), however this presents some problems—for instance, it doesn’t preserve distances in the new space. For this reason, we used another approach to encoding the categorical data: embedding using an ensemble of trees. In this case, we used XGBoost.
The approach works as follows:
- First, fit an ensemble of trees (totally random trees, a random forest, or gradient boosted trees) on the training set
- Then each leaf of each tree in the ensemble is assigned a fixed arbitrary feature index in a new feature space
- These leaf indices are then encoded in a one-hot fashion
Each sample goes through the decisions of each tree in the ensemble and ends up in one leaf per tree. The sample is encoded by setting feature values for these leaves to 1 and all other feature values to 0.
The resulting transformer learns a supervised, sparse, high-dimensional categorical embedding of the data.
I created a demo of this implementation with good results. The new embedding outperformed OHE, although with a time cost that increased the runtime of the survival model to 10 minutes compared with 4 minutes for OHE. This wasn’t a major problem since the model wasn’t intended to be run frequently.
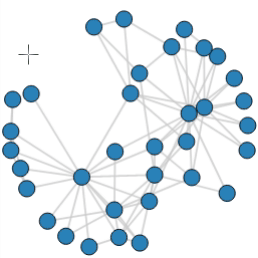
Visualization and Supply Chain
Finally, the visualization was created using the Bokeh package, as shown below. The graph was interactive and dynamic, allowing users to visualize the evolution of the model across different years and explore various scenarios.
This interactive dashboard became a key tool for the client to make data-driven decisions about their server component procurement and deployment strategies.